
Using LSS to Improve Customer Service: A Case Study by Eric Thompson
Did you know the number of people working from home tripled from 2019 to 2021? According to the U. S. Census Bureau the number of employees primarily working from home went from ~9M to 27.6M workers during this period. That’s roughly equivalent to all the people – men, women, and children – in Colorado, Louisiana, Wisconsin, Minnesota, and Kentucky combined!
Adapting to a work-from-home (WFH) model was a big challenge for many employees during this period. This was true for one large Dallas-based company which decided to move their customer service team from a centralized call center to their homes in the Spring of 2020. Unfortunately, this change resulted in some problems in serving customer needs.
First, a little background. The call center for this company had hundreds of Customer Service Representatives (CSRs). They were responsible for managing thousands of customer interactions daily. Those interactions could occur via phone, email, or web forms. When the decision was made to switch to a home-based model the employees were equipped with basic tools like laptops, mice, and headsets.
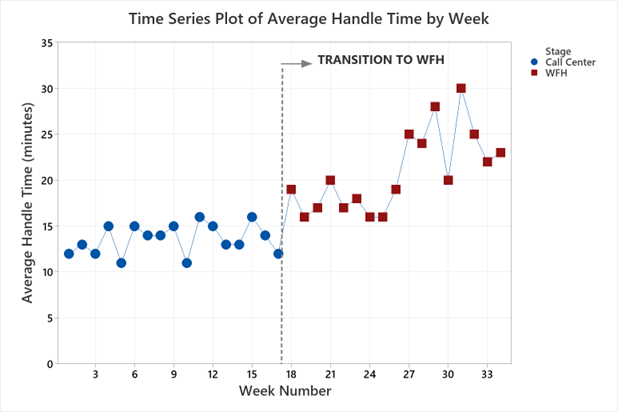
Unfortunately, this transition led to an unexpected increase in the Average Handle Time (AHT). The AHT is the duration required to address a customer’s issue and is considered the Critical Customer Requirement for a Call Center. This increase in AHT resulted in unhappy customers, potentially leading to lost revenue. It also posed a significant financial burden due to increased costs to the company.
Fortunately, this company had a Continuous Improvement Program in place which used Lean Six Sigma. With the Covid-19 pandemic still a threat, the decision was made to keep the call center employees working from home. The Leadership Team tasked the CI Group with using a data-based approach to understand the root cause of this problem. And to come up with a solution to restore the AHT – and customer service – to pre-COVID levels.
To understand the financial impact of the increase in handling time, the Team looked at some basic productivity data. This included Average Handle Time, Full Burden Rate (the total hourly cost to employ a worker), and Case Volume per Week (assuming 5,000 cases per week). For transparency and security’s sake, the financial information shown here is representative data, not the actual cost data.
| Location | AVG Handle Time (minutes) | Full Burden Rate ($/hr) | Handle Cost per Case | Handle Cost per Week |
| Call Center | 13.5 | $60 | $13.50 | $67,500 |
| WFH | 20.8 | $60 | $20.80 | $104,000 |
The challenge was to substantiate this root cause hypothesis with data before recommending an investment in additional IT equipment. Fortunately for this company the CSRs were using a variety of setups in their home offices. Some CSRs had just their laptop. Others had managed to scrounge a second screen as a supplement to their laptop.
This created what statisticians call a natural experiment. Although not planned, data soon became available on both groups of CSRs: Those with a single screen in their home office and others with a dual-screen arrangement.
Black Belts from this firm’s Continuous Improvement Group were tasked with gathering and analyzing data. The process, spanning just a few days, involved a combination of graphical and analytical methods.
1. Graphical Analysis: Utilizing historical AHT data, the team created a boxplot to compare call center, where CSRs had two screens, and work-from-home handle times. The chart revealed greater variation and higher AHTs with remote work, visually validating the hypothesis of a performance shift.
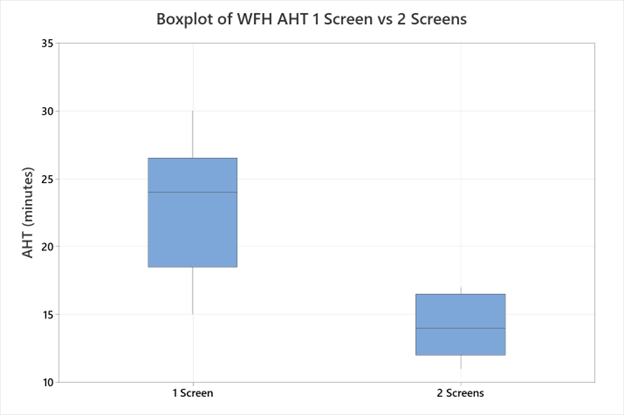
2. Data Stratification: To confirm the hypothesis the BBs needed data on the different types of setups of the CSRs. Basically, they needed to stratify the AHT data based on number of screens in use. Supervisors conducted a poll to understand the home setups of employees. CSRs were categorized into two groups: those using only a laptop (1 screen) and those using a laptop with an additional monitor (2 screens).
3. Boxplot Analysis: A boxplot of AHTs for the two groups showed a noticeable difference in performance, suggesting that screen setup might indeed impact efficiency.
Analytical Verification: To confirm the graphical findings, a series of 2-Sample T-tests were conducted. The mean AHT of the historical (dual-screen, in office) group was compared to the mean AHTs of both the at-home, single-screen group and the at-home, dual-screen group.
Two-Sample T-Test and CI: 1 Screen, Call Center
Descriptive Statistics
| Sample | N | Mean | StDev | SE Mean |
| 1 Screen | 17 | 22.24 | 4.96 | 1.2 |
| Call Center | 17 | 13.59 | 1.62 | 0.39 |
Test
| Null hypothesis | H₀: μ₁ – µ₂ = 0 | |||
| Alternative hypothesis | H₁: μ₁ – µ₂ ≠ 0 | |||
| T-Value | DF | P-Value | ||
| 6.84 | 19 | 0.000 | ||
Two-Sample T-Test and CI: 2 Screens, Call Center
Descriptive Statistics
| Sample | N | Mean | StDev | SE Mean |
| 2 Screens | 17 | 14.18 | 2.19 | 0.53 |
| Call Center | 17 | 13.59 | 1.62 | 0.39 |
Test
| Null hypothesis | H₀: μ₁ – µ₂ = 0 | |||
| Alternative hypothesis | H₁: μ₁ – µ₂ ≠ 0 | |||
| T-Value | DF | P-Value | ||
| 0.89 | 29 | 0.380 | ||
The results confirmed that the mean AHT of the historical (dual-screen) group and the at-home (single-screen) group were not equal (p = 0.000), while the historical group and the at-home (dual-screen) group were statistically the same (p = 0.380).
Business Decision & Results
With conclusive evidence supporting the hypothesis, the next step was a cost-benefit analysis. In essence, the project team was now in the Improve Phase. The cost of providing monitors to remote employees was weighed against the financial impact of prolonged AHT. The analysis demonstrated that investing in monitors was a “no-brainer” decision.
Following the implementation of this solution, AHTs began to return to historical norms (see run chart below). This not only validated the investment but also showcased the effectiveness of using LSS tools for making data-driven business decisions.
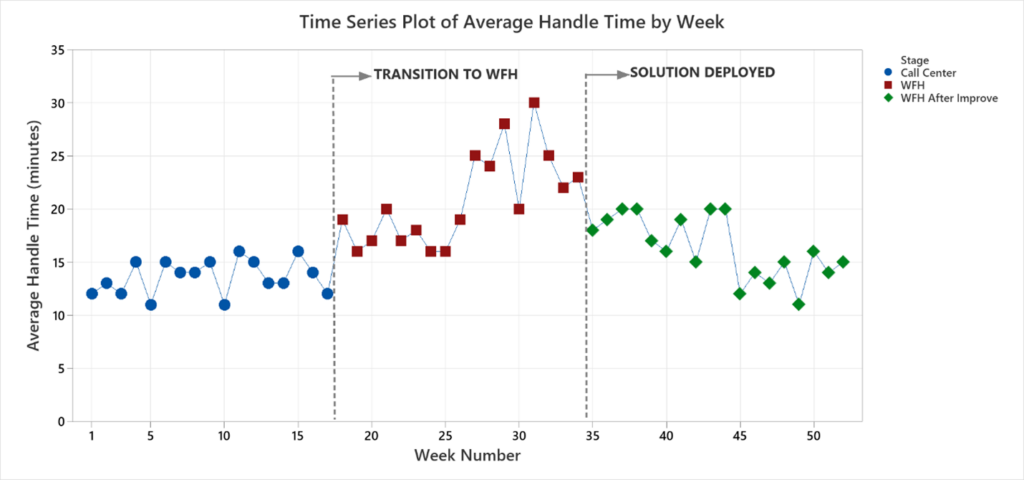
In essence, this project was a Quick Win. Data were readily available, the improvements were easy to implement, and the team had the authority to make the improvements. Plus, almost all of the work was completed in less than a week.
Additional Insights
- Employee Feedback: After the implementation of additional monitors, employees reported a significant improvement in their ability to manage multiple tasks. This feedback further reinforced the decision to provide the necessary tools to optimize remote work efficiency. This led to not only an improvement in customer service but also in employee morale.
- Training and Development: Alongside the technical improvements, the company invested in training programs to help employees adapt to new tools and technologies. Regular training sessions were conducted to enhance their skills and ensure they could leverage the full potential of the provided equipment.
- Future Applications of LSS: The success of this initiative encouraged leadership to explore further applications of Lean Six Sigma tools in responding to daily issues.
Final Thoughts
This case study illustrates how a data-driven approach, underpinned by Lean Six Sigma methodologies, can effectively address operational inefficiencies and support informed decision-making on a daily basis. Stated differently, careful application of LSS tools can help management answer questions and solve problems without launching full DMAIC projects. As organizations continue to navigate the evolving business landscape, the principles of LSS offer a robust framework for achieving sustainable improvements and maintaining a competitive edge.
