
Can I Trust My Measurement System? Part 3 – Case Studies
In our February blog we provided an overview of Measurement System Analysis for continuous data. Specifically, we explained the TMAC approach to plan and conduct a Gage R&R Study. Then in our March blog we discussed how to interpret the output from a Gage R&R Study. In addition, we shared insights on how to fix a measurement system if it does not pass commonly accepted study guidelines. In this month’s final blog of this 3-part series we share two case studies of a measurement system analysis performed at a TMAC customer.
Case Study 1: This company is a tier one supplier for the automotive industry. The management team asked TMAC to assess the measurement system used to measure the shaft diameter of a commonly used part. This was a nondestructive test.
After discussing different options with the quality manager, we decided to do an AIAG Long Form Study. This consisted of measuring 10 parts with three operators. Each operator was asked to measure each part three times (i.e., there were three replicates). This approach resulted in a total of 90 data values.
Before starting any measurements, we worked closely with the quality manager to carefully select the parts for the study. We made sure those 10 parts represented the full range of process variation.
Here is a photo of the measuring instrument and part:
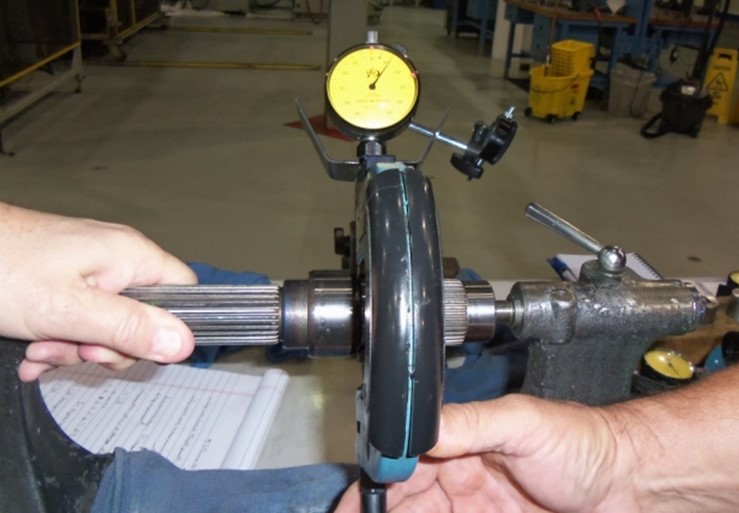
As we explained in Part 1 of the blog, the best practice during an MSA is to use a blind, random approach. That is, the operators did not know which part was #1, #2, etc. Hence a blind study. Secondly, the sequence of parts was randomized. The combination of these methods helped to minimize the risk of bias.
After completing the study, the resulting data were entered into Minitab, and the Gage R&R Study (Crossed) analysis performed. This analysis is used for nondestructive tests.
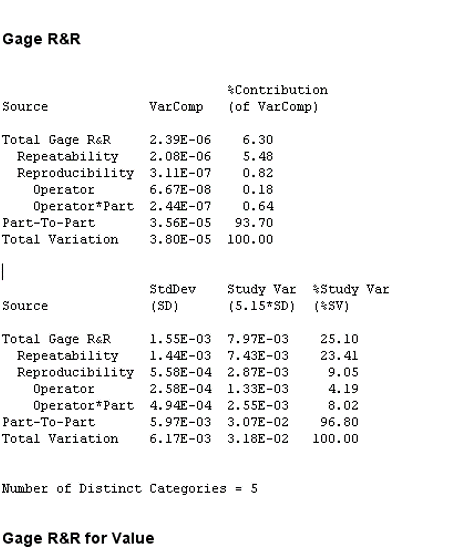
Here is portion of the output:
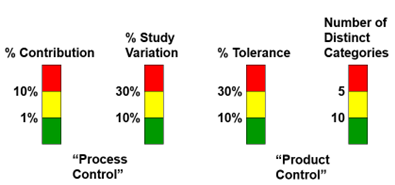
As a quick review, here is a graphic from our blog in March which shows values for a Bad, Acceptable, and Good Measurement System:
Now let’s look at the Minitab output for Case Study 1 section by section. First, on the % Contribution output the Total Gage R&R is 6.3%. This value would be deemed an adequate measurement system due to being less than 10%. If it had been less than 1% it would be considered an excellent measurement system.
It is interesting to note that most of the % Contribution variation is for Repeatability (5.48%, as compared to only 0.82% for Reproducibility). Normally operators agree within themselves (Repeatability) but encounter more variation between operators (Reproducibility).
For the % Study Variation the Total Gage R&R is 25.1%. This is less than 30%, which is the upper threshold of an adequate measurement system. An excellent measurement system would be less than 10%.
As for the resolution of the measurement system, it is expressed as the Number of Distinct Categories. Sometimes called the Discrimination Index, higher is better for this measure. The value of 5 is on the low end of an adequate measurement system. A value of 4 or lower is considered bad and 5 to 9 is considered OK. A Discrimination Index of 10 or higher is considered to be good.
The overall conclusion for Case 1: This measurement system is adequate.
Case Study 2: For this scenario the goal is to measure the torque on a bolt in an assembly. The unit of measure is Newton Meters (Nm). Unlike Case Study 1, this is a destructive test. Basically, force is slowly applied to a bolt until it breaks off the assembly.
Because this is a destructive test the same part cannot be measured multiple times. That presents a dilemma as MSA studies are based on the variation which occurs from measuring the same part more than once. To overcome this limitation for destructive tests, practitioners select parts for the study which are deemed to have the same properties. NOTE: This is not easy to do.
In this situation a total of 18 parts were selected. But they were treated as if there were 9 parts. Think of it this way: Parts 1A and 1B were thought to have essentially the same critical characteristics. Likewise, parts 2A and 2B, 3A and 3B, etc.
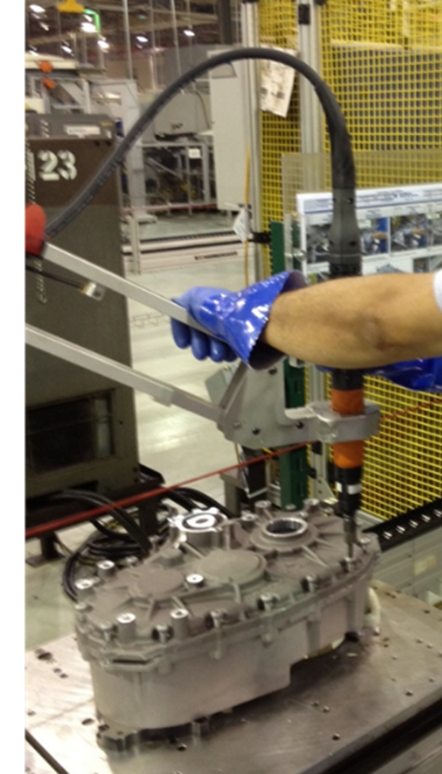
The overall design of this Gage R&R study was to use 18 parts, with 2 operators and 2 replicates. The specification limits were known. As with Case Study 1 this was a blind, random study.
Here is a photo of the test being performed:
After data were entered into Minitab a Gage R&R (Nested) analysis was performed. This is the appropriate analysis for destructive tests.
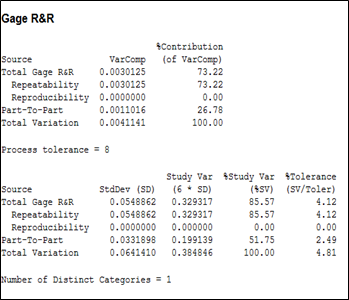
Clearly this is a bad measurement system. The % Contribution is much too high (73.2%) as is the % Study Variation (85.6%). And the Number of Distinct Categories is much too low (1). But there is one figure which looks great: The % Tolerance is only 4.1%.
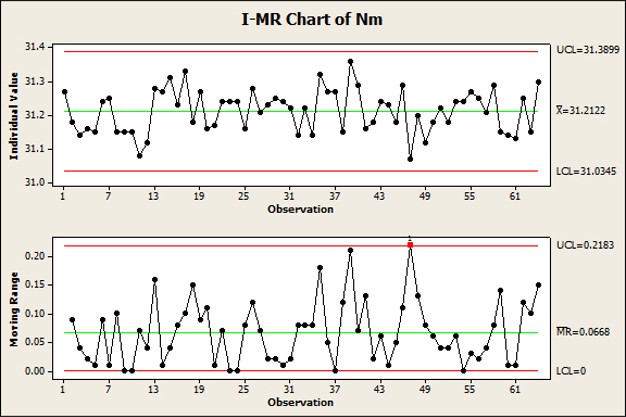
Intrigued by this result, we collected data from the process to assess control and capability. Here are the resulting charts:
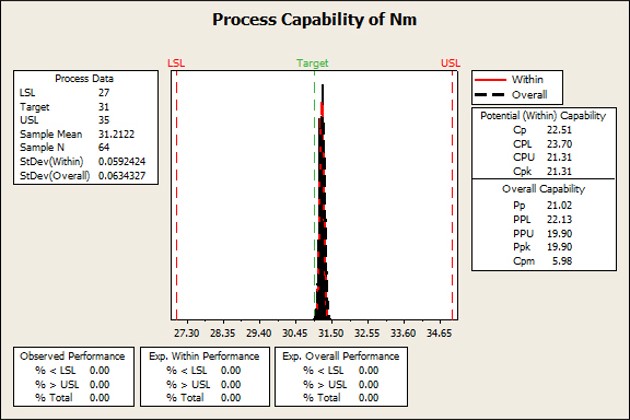
A Ppk of almost 20 is incredible. Remember – any Ppk value above 1.33 is considered to be a capable process.
How to reconcile these outcomes?
On the one hand, the measurement system fails the criteria to adequately measure the parts. However, this could be largely an issue with selecting parts with truly similar characteristics. On the other hand, the process is in control (from a practical standpoint) and extremely capable of meeting the specification limits.
In a future blog we will discuss performing MSA for Attribute Data. In the meantime, let us know of any questions about Measurement System Analysis.
