Can I Trust My Measurement System? Part 2
Did you know a measurement system error once resulted in a $125M mistake for NASA? It’s true. Back in 1998 NASA launched the Mars Climate Orbiter. After 10 months of travel to the Red Planet the orbiter burned up due to problems with the thrusters. The root cause? The navigation team used the metric system for their calculations, while the equipment design company used the English unit of measures. For more on this story here.
In Part 1 of this blog, we discussed how to Plan and Conduct a Gage R&R Study. Performing Measurement System Analysis (MSA) is a critical activity in the Measure Phase of the DMAIC Process. Gage R&R is one way to validate a Measurement System. MSA is also used in the Control Phase.
In Part 2, we review how to interpret the output of such a study. And discuss potential problems with a measurement system and what can be done to fix them.
Before discussing how to interpret the output of a Gage R&R study we will provide a quick review of measurement system concepts. As with Part 1 of this blog our focus is on continuous data.
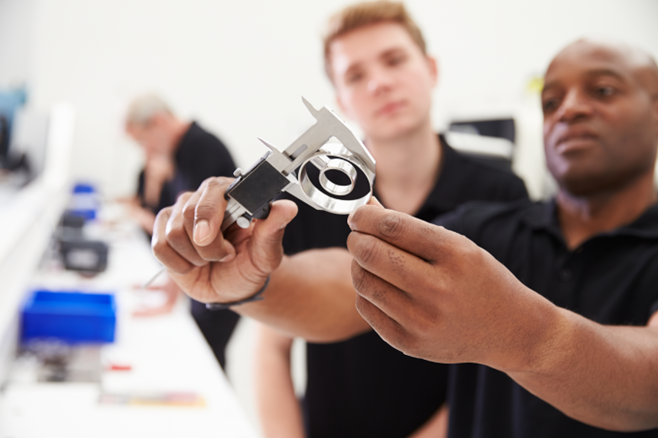
A measurement system is used to measure a critical characteristic of a part, process, or service. For example, a hole in a metal part may have a designed diameter of 0.5 inches. The actual diameter of manufactured parts should be checked on a regular schedule using a device such as a caliper.
The Observed Measurement is slightly different from the True Value of that critical characteristic. Imagine if the Observed Measurement is 0.5035 inches for the hole diameter. But the True Value is actually 0.5028 inches. The difference between the True Value and the Observed Measurement is considered to be Measurement Error. This error can be due to several different sources as shown in this graphic:
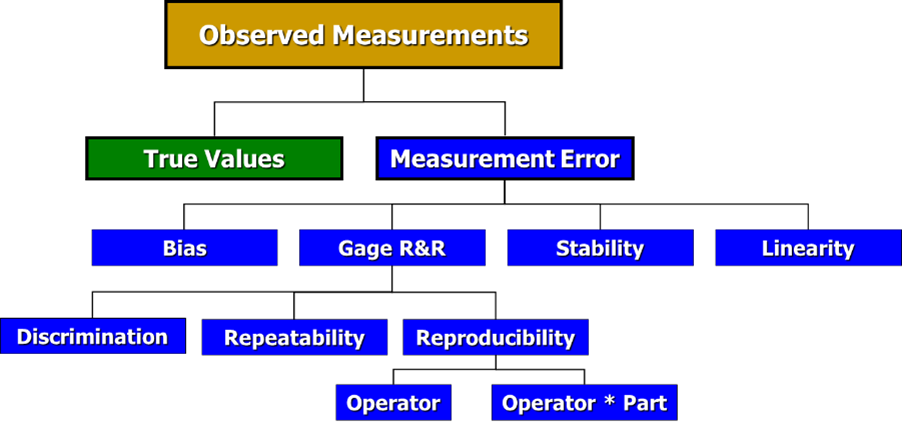
Let’s look at each one of these sources of Measurement Error.
Bias is the distance between the observed average measurement and the true value, or “right” answer. It can occur due to the operator, instrument, parts, and many other causes. For example, selecting the best operator to conduct the measurement will result in a different average than if the study was conducted using all the operators. Another example: Selecting only good parts for the study instead of parts which are representative of the full variation of what is produced. Avoid bias at all costs.
Stability refers to a change of the measurement value over time when measuring the same item. The goal is to have this value be the same in an hour, a day, or a week. Suppose we are working at a paper mill. A critical characteristic is paper strength. When the paper has just come off the production line the water content is higher, resulting in a lower strength of the paper. By waiting for time to pass the paper goes through a natural curing process resulting in a lower water content. Once cured properly the paper strength increases. When the paper is totally cured the strength will stabilize, resulting in consistent measurement values over time.
Linearity is the variation which occurs across the entire range of the measuring instrument. Suppose we measure weight using a scale that ranges from 1 to 300 pounds. For items between 1 to 50 pounds, the weight variation is +/- 1 pound. But for items between 51 to 150 pounds the weight variation is +/- 5 pounds. And for large items, with a range between 151 to 300 pounds, the weight variation is +/- 10 pounds. This is an example of a gage with poor linearity. Ideally, the variation is the same across the entire range used.
Discrimination is the level of resolution of a measuring device. Imagine trying to measure the thickness of a small part with a yard stick. That is an example of a measuring device with poor discrimination for the application. In this case better devices include a caliper (1/100 of an inch) or a micrometer (1/1,000 of an inch).
Gage R&R stands for Repeatability and Reproducibility.
Repeatability is the inherent variability of the measurement system. It is the variation that occurs when successive measurements are made under the same conditions: part, characteristic, person, instrument, set-up, environment conditions, etc. If an inspector gets very close to the same results when measuring the same item multiple times then we conclude his or her repeatability is good.
Reproducibility is the variation in the average of the measurements made by different operators using the same measuring instrument when measuring the identical characteristic on the same part. If three people get virtually the same results when measuring the same part multiple times then we can say they have good reproducibility.
A simple mnemonic to help remember this: ‘It takes One to Repeat, Two to Reproduce’.
Problems with any of these properties can cause a measurement system to fail. When this occurs, LSS practitioners need to identify the source(s) of variation and address them in order to validate the measurement system.
Note: Gage R&R Studies are used to measure the Precision of a Measurement System. A different kind of study – a Linearity and Bias Study – is used to measure the Accuracy of a Measurement System.
Now, let’s imagine a Gage R&R study has been performed. And it is time to interpret the results of the study. See Part 1 of this blog for the details about planning and conducting such a study.
There are four key measures to be checked to assess whether a measurement system is acceptable. The following diagram will guide you to determine if the measurement system passes, fails, or is adequate.
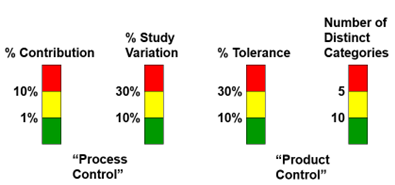
Guidelines To Validate a Measurement System:
- Excellent: All four characteristics in green zone.
- Good: Two to three characteristics in the green zone.
- Adequate: Three to four in the yellow zone.
- Fails: One or more characteristic in the red zone
If one or more of the characteristics is in the red zone, we must identify the root cause, address it, and then run another Gage R&R Study.
Let’s look at an example. Here are the numerical results from a Gage R&R Study:
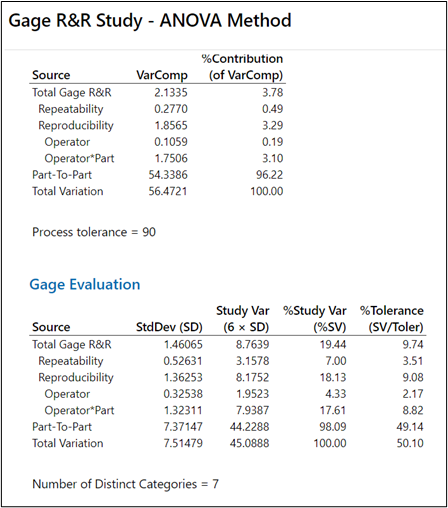
For this example, we have three characteristics in Yellow (% Contribution, Number of Distinct Categories, % Study Variation) and one in Green (%Tolerance). Conclusion: This is an Adequate Measurement System.
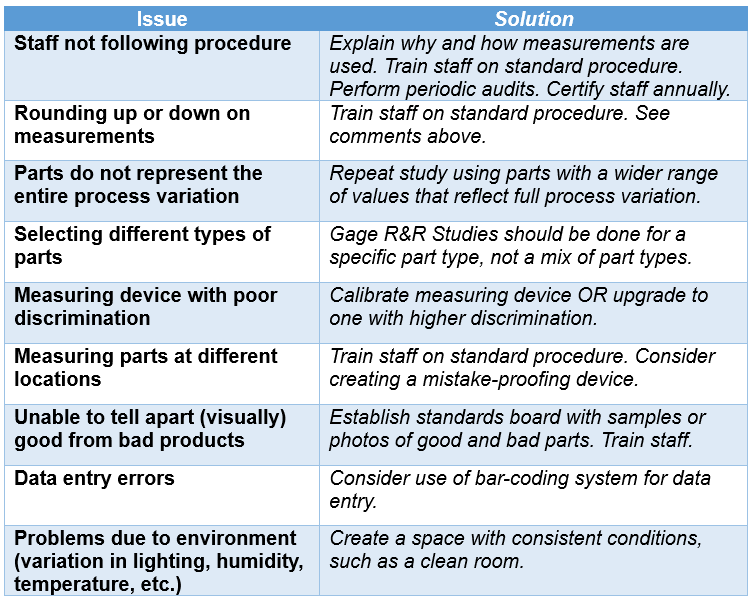
Remember – if any of the four characteristics are Red the measurement system has failed. Unfortunately, each failed MSA is unique. Here is a partial list of Issues that can result in a failed Gage R&R Study, and recommended Solutions:
In addition to the numerical output shown in the example, any good statistical software package will also include graphical output. These graphs can provide guidance on what went wrong with a Gage R&R study. There are too many possible issues with measurement systems to show in this blog. The good news: If you do have measurement system that fails you can always contact us at TMAC for help.
In Part 3 of this blog, we will share a case study of using a Gage R&R Study to validate a measurement system.
