
The Art of Process Mapping
Throughout my career, as an Industrial Engineer and a Continuous Improvement professional, if there is one tool I have used in abundance, it is Process Mapping. As a visual person, it is my go-to tool. In many situations, it helped me wrap my head around what’s going on in a process or conversation and make intelligent responses. I’ve even used mapping during coaching sessions with LSS students on their projects. During coaching I sometimes “whiteboard” the conversation in a flow, which not only helps me understand the situation, but also actually helps the student have clarity on their thoughts.
While process mapping may be considered a very basic tool, over the years I have seen many variations. In some instances there are missed opportunities in their application In this first of a 2-part series on process mapping, I will discuss common mapping methods and my experiences using this powerful tool. In Part 2 I will discuss best practices in mapping and how to maximize their use.
First, what is process mapping?
At its core, process mapping is a graphical depiction of a series of activities in a process that transform inputs into outputs.
Depending on where used and the context, process maps can take several forms and vary in the level of depth and details provided. For example, when used within the context of a quality management system, maps may be used to document key processes. In an LSS context, they are primarily used to identify constraint operations, determine where to collect process data, and facilitate brainstorming of improvement opportunities. In other instances, process maps might be used to depict and understand a customer’s interaction with a business every step of the way within a process, such as with a Customer Journey Map, discussed later.
No matter the format and context, the major benefits of process mapping include:
- Increased understanding of processes
- Identification of improvement opportunities
- Improved communication between stakeholders
- Documentation of a process
The act of creating a process map can have a powerful effect on those involved, especially when the participants know little about what occurs upstream and downstream from their own operation. In addition to the increased understanding and better communications noted above there is often a sense of accomplishment that comes out of creating a process map. Another important benefit: It is common for many questions to come out of a mapping session. This is a great thing. Maps help identify where more information is needed to solve problems and answer business questions. This is why most maps should be created over at least two sessions. That allows the mappers to investigate the answers to those questions and to gather for the second session to develop richer, more detailed, and nuanced maps.
Process Mapping techniques have evolved from simple flowcharting to more sophisticated methods such as Value Stream Mapping, Customer Journey Mapping, IDEF Modeling, and Business Process Mapping and Notation (BPMN). These techniques vary by industry sector, establishing a common language to understand and communicate processes within that sector. Today, in most LSS programs, the common mapping techniques taught to students include SIPOCs, Spaghetti Maps, Swim Lanes and Value Stream Maps.
Here is a brief overview of the common mapping techniques and some that are uncommon. (Note: Mapping techniques discussed here are primarily in the context of business/manufacturing sectors.)
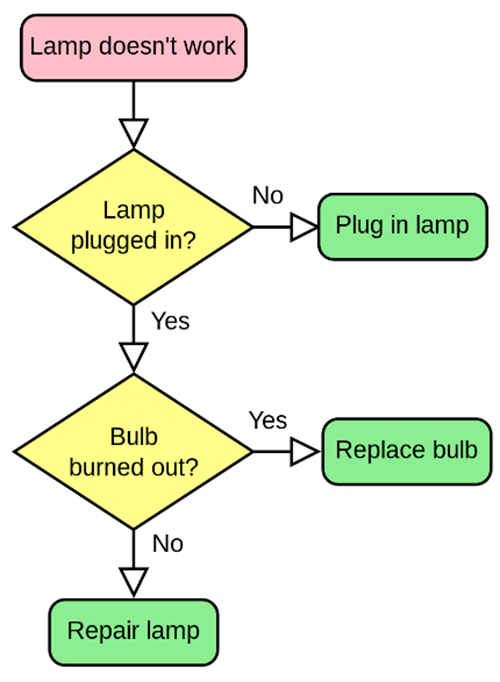
- Flow Chart – A graphical representation of the logical sequences of steps within the process from start to finish using commonly accepted symbology. In its simplest form, just depicts “what” happens in the process, not the “who” nor the “time” it takes to complete the task.
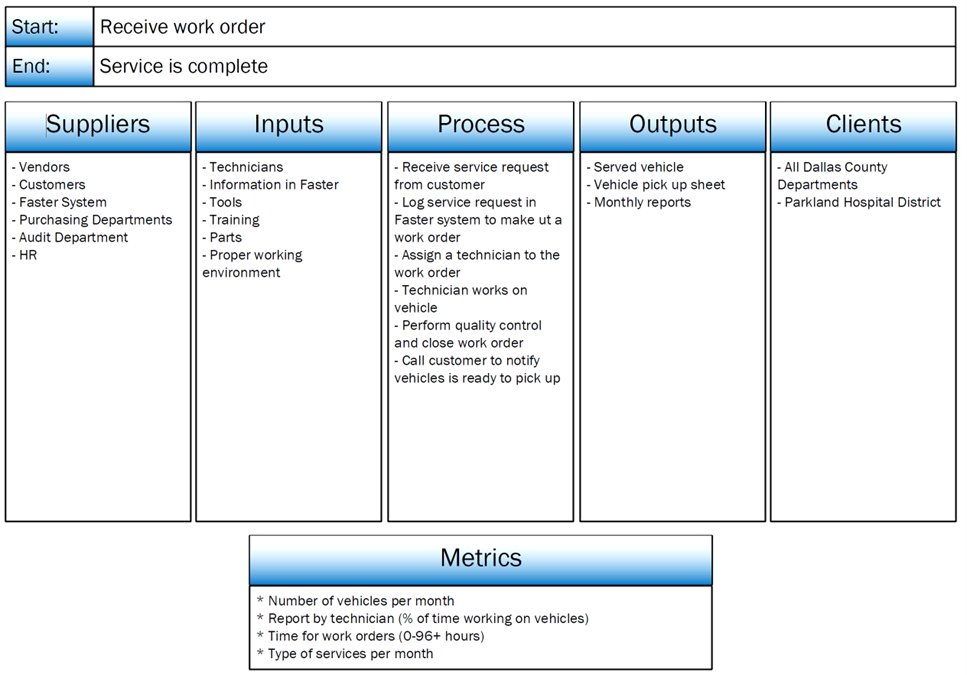
2. SIPOC – stands for Supplier-Inputs-Process-Outputs-Customer. Provides a high-level snapshot of what the process does, where its inputs come from and who consumes its outputs. Helps understand all the stakeholders and their expectations at a high level. They also are used to help establish the scope of a process in terms of start and end points. SIPOCs are a required deliverable in the Define phase of any LSS project.
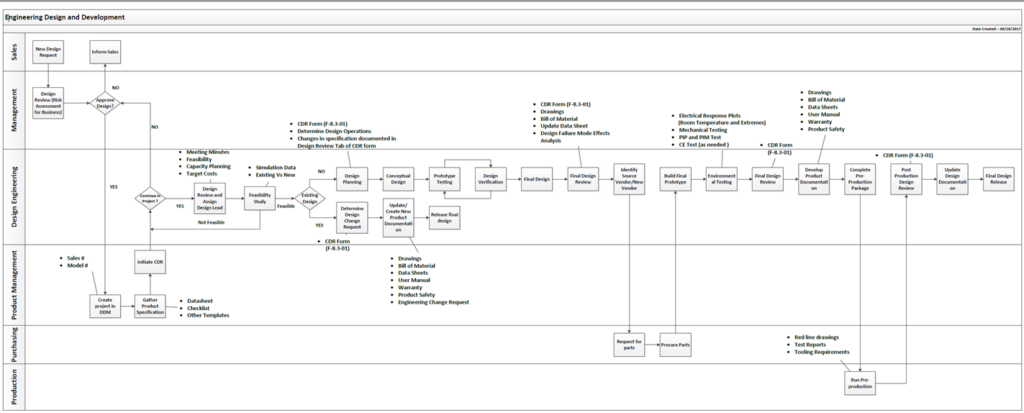
3. Swim Lane Map – Similar to process maps, but they provide an extra layer of clarity by segregating the process steps by “Who does what”. The process steps are shown graphically in lanes or channels which represent specific departments or functions. Swim Lane Maps show connections, communications and handoffs between these lanes. They can serve to highlight waste, redundancy and inefficiency in a process. Depending on the process, these maps can get very big.
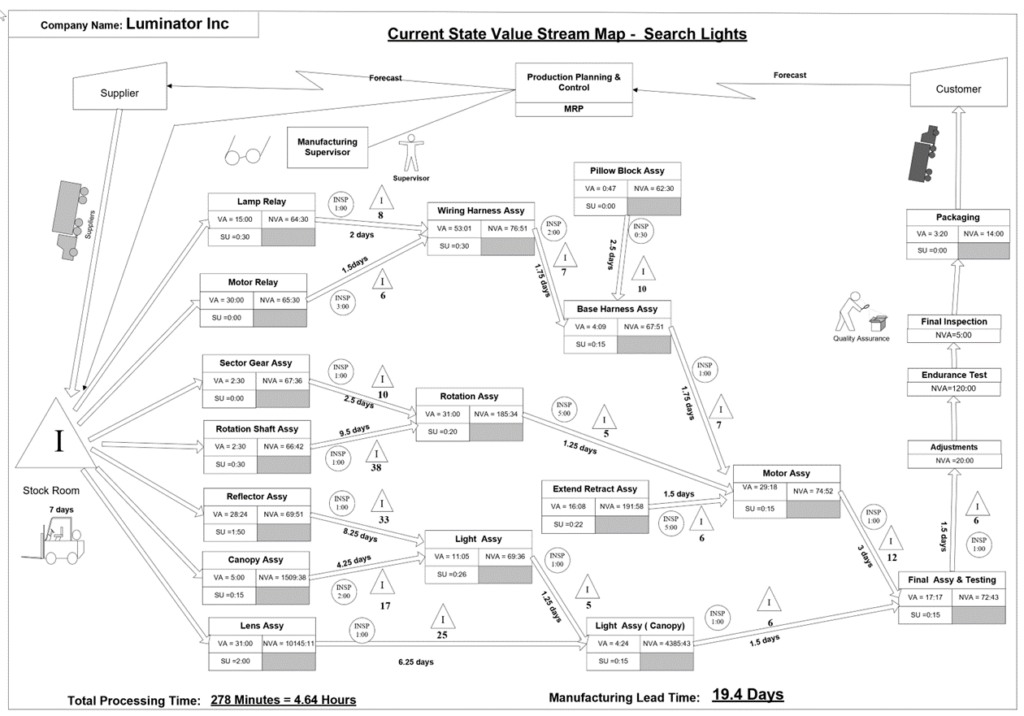
4. Value Stream Map – Also called “a Data Rich Map”, VSMs are a special type ofprocess map, primarily taught and used by Lean professionals. They are used to analyze, design and manage the flow of materials and information required to make a product that can meet required customer demand. VSMs use a system of standard symbols to depict various work streams and information flows. Activities are identified as either adding value or not adding value from the customer’s standpoint. Value Stream Maps are then used to determine what improvements can be implemented with the goal of eliminating or minimizing activities that don’t add value.
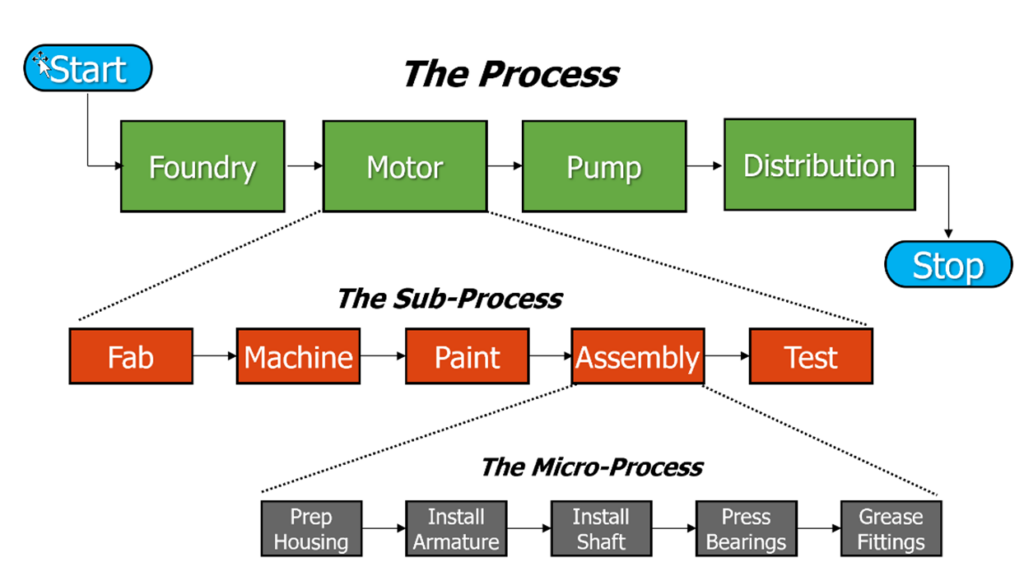
5. Top-Down Map – Another type of flow chart thatprovides FOCUS by selectively expanding from the highest level down to the level appropriate for solving the problem. It is a vertical look at a process, and allows mappers to drill down to the point of interest.
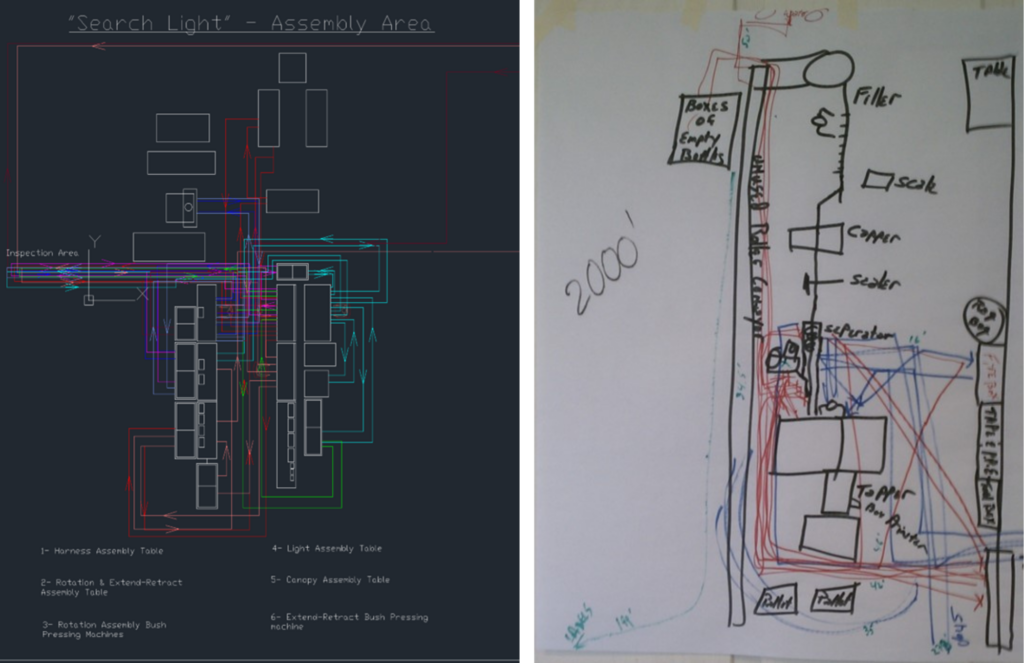
6. Spaghetti Map – It is a visual representation of the physical path of a product/item as it goes through a process. Such maps provide documentation of the current routing and distance traveled, and are used during lean implementations to identify Transportation Waste and expedite the process flow. They can also help identify redundant movement such as when a worker has to go back and forth multiple times between two workstations.
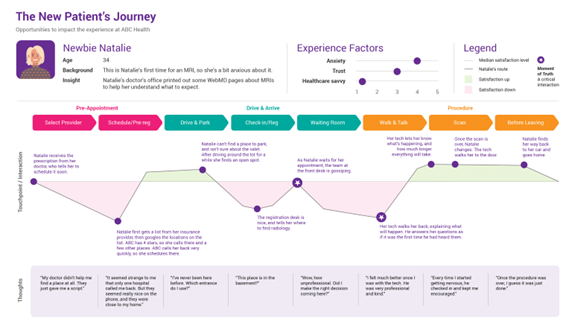
7. Customer Journey Map – Gaining popularity in the past few years, it is a diagram that depicts the various stages customers go through when interacting with a process. It truly is a customer-oriented mapping exercise providing an outside-in perspective on the process. It allows improvement teams to prioritize activities that make an impact on customers and businesses. This type of process map also helps foster a customer-centric culture within the organization.
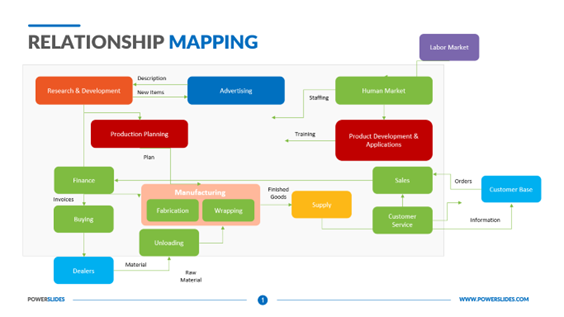
8. Relationship Map – is a graphical view of relationships between individuals, processes, or organizations. Identifies the connections between key stakeholders. The relationships can be one-to-one, one-to-many, many-to-one or many-to-many.
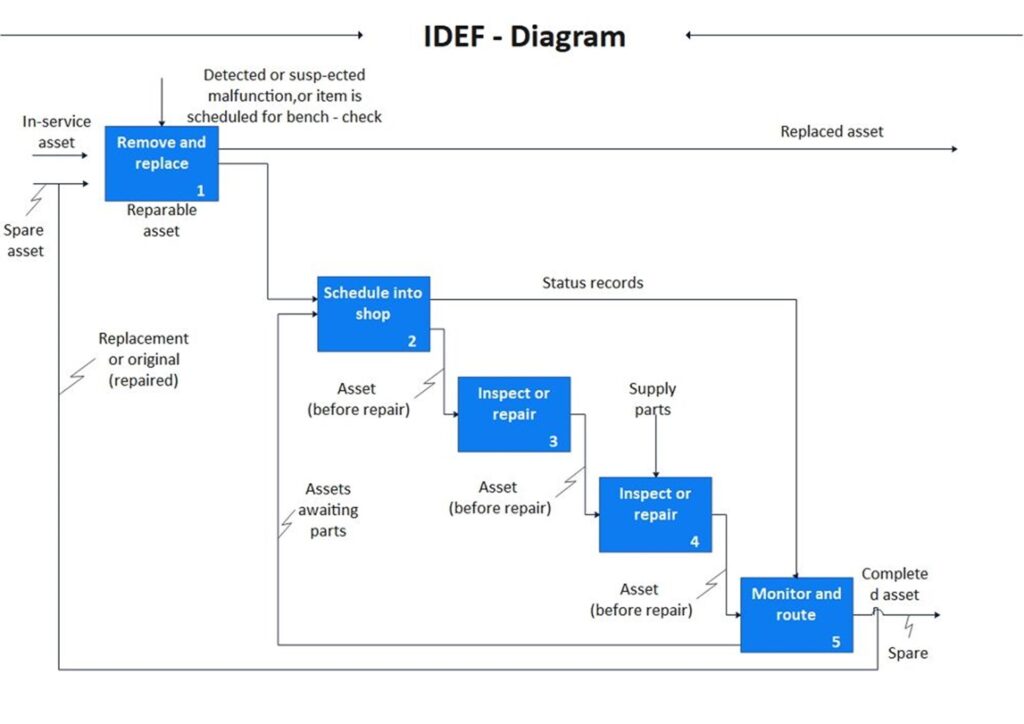
9. IDEF Modeling – Integrated DEFinition Methods is a Structured Approach to Enterprise Modeling & Analysis. Although not commonly used in practical applications, it has a family of modeling languages (IDEF0 to IDEF14) where the rules require sufficient rigor and precision to satisfy needs without overly constraining the process analyst. IDEF models must have a top-down, modular, hierarchical structure.
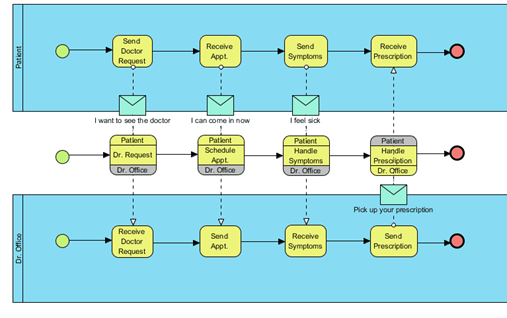
10. Business Process Map & Notation (BPMN) – is a precise graphical notation for describing business processes. It is like traditional process maps, but it comes with its own set of symbols and elements. These maps help stakeholders visualize business processes to facilitate improvement of workflows. Primary elements of a BPMN diagram are flow objects, connecting objects, swim lanes and data.
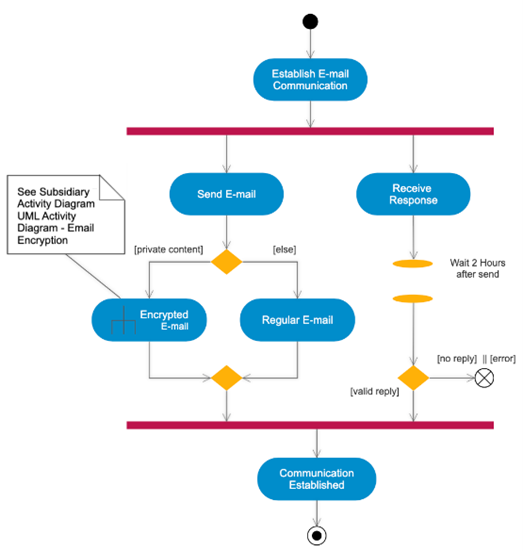
11. UML Diagram – Unified Modeling Language mapping is a visual representation of architecture, design and implementation of a complex software system. Primarily utilized in the software industry, UML Diagrams are used to visualize a project before it takes place and as documentation for a project afterward. While this type of mapping is not common with LSS practitioners, UML Diagrams do help teams understand the complexity of software systems.
(Phew!! Hope you are still with me.) As you can see there are many different process mapping techniques to choose from. The recommended type of mapping technique depends on your situation. In some cases, more than one type of map may be appropriate for the same problem. Below is a free, downloadable table comparing the types of maps.
In Part 2 of this series, I will provide some Best Practices – along with Lessons Learned – in process mapping. Facilitation of a mapping session can be challenging. But with good planning and preparation you can have success with this powerful tool.
