
Process Capability: A Critical Management Tool (Part 2)
In part 1 of this blog (Process Capability: A Critical Management Tool – Part 1), we covered the basics of process capability and its use as a Management tool. The focus of that blog was on capability analysis with continuous data that are normally distributed.
In this second in our series on capability, I would like to discuss some additional concepts and scenarios where capability can be used:
- Short Term vs. Long Term Capability
- Continuous Data, Normally Distributed, Target Not Centered
Before going further, here is a refresher on the basics.
- Process capability can be described as the ratio of allowed variation (VOC – Voice of Customer) to expected variation (VOP – Voice of Process).
- Capability is measured using two unit-less indices – Cp and Cpk. Think of Cp as the “Process Potential” and Cpk as the “Process Performance”.
- A common goal for Cp and Cpk values is 1.33 or higher. For critical processes (e.g., those involving safety) this goal may be increased to 1.67.
- All pre-requisites of capability studies have to be verified prior to trusting the capability results. Most important of these is that a process is in statistical control.
One great thing about capability analysis is that it can be easily understood with graphics. In the image below, the VOC is represented by the red lines – shown as the Lower Specification Limit and Upper Specification Limit – and the VOP which is represented by the histogram.
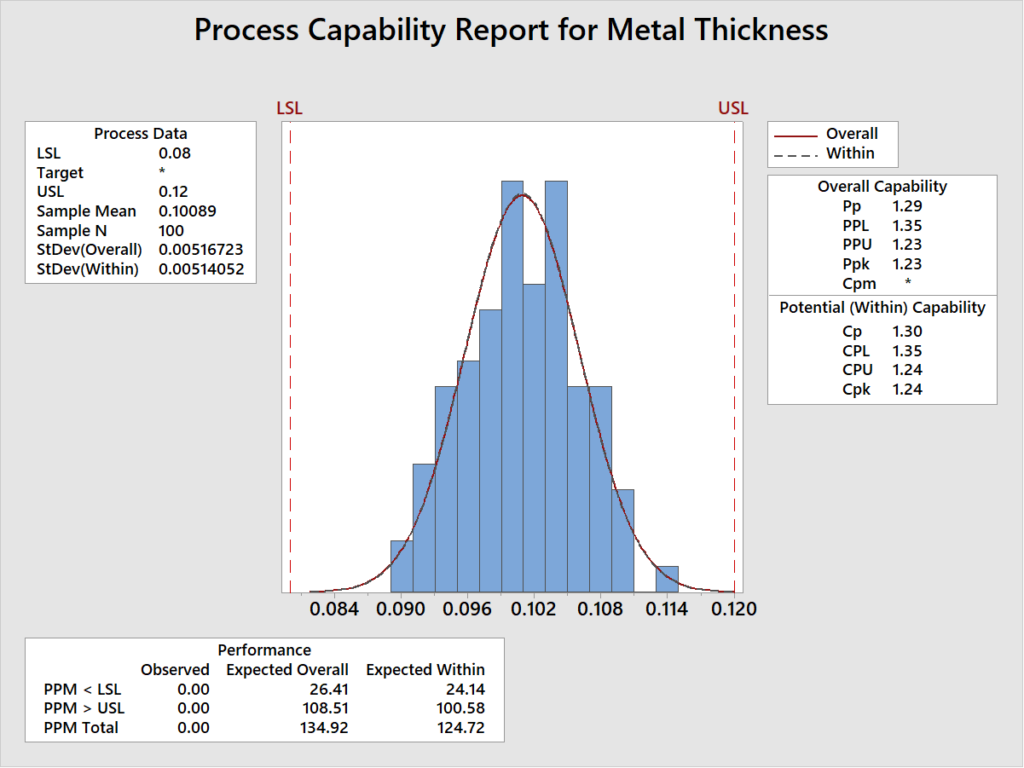
Note that the Cp and Cpk capability measures are shown. However, you also get additional information such as Pp, Ppk & Cpm. What do these terms mean? And what can you infer from them?
“Short Term” vs “Long Term” Capability
When one performs a process capability study, the capability indices are calculated using the historical data obtained by sampling from the process. Since sampling is a subset of a whole population, when multiple samples are taken from the process, the sample statistics also vary. This shows that process shift happens over time. To account for this process shift, capability studies use two additional indices – Pp and Ppk – also known as process performance ratios.
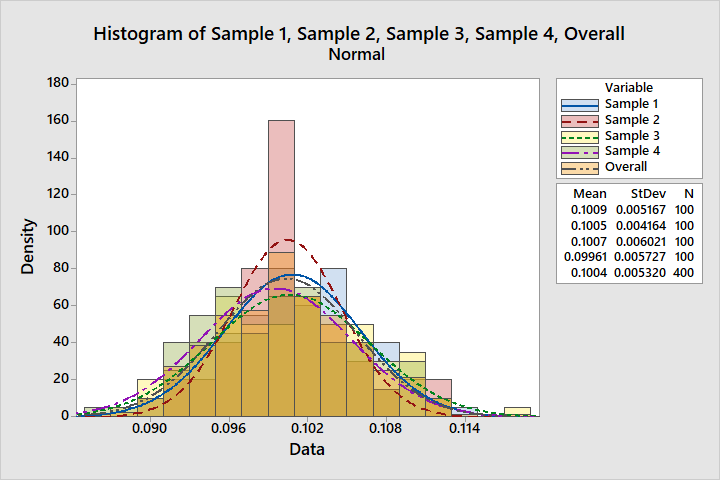
Illustration of Process variation over multiple samples
So when to use Pp, Ppk instead of Cp, Cpk?
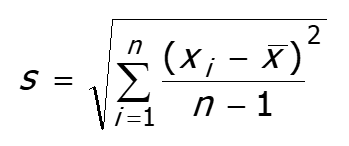
When a new process is established or a process improvement activity results in a new improved process, the initial data obtained from sampling might not be enough to confirm full process potential. This is because the process has not generated sufficient data points to capture the natural process variation. The Cp and Cpk indices are better predictors of process capability in this instance since they are calculated using the within subgroup variations of the sample data. The calculation of this variation is done by estimating standard deviation using this formula from control chart theory:
The R-bar value is the mean of the range values of a series of subgroups. Hence, the within subgroup variation. The d2 value is a constant derived for control charts.
Now, if a large amount of historical data is available from a predictable process (i.e., one that is statistically in control), you can assume that the data represents the potential process shift over time. In other words, it is safe to assume that the process might have experienced all the process variation that it is likely to experience over a longer period. In such a case, Pp and Ppk are better metrics for estimating process capability. The Pp and Ppk indices are calculated using the overall variation of the process, sometimes called the pooled standard deviation:
So, when you use Cp & Cpk, you are answering, In the short term, is my current sample capable of meeting customer expectations? Whereas, when you use Pp & Ppk, you are answering, In the long term, is my overall process capable of meeting customer expectations? The overall capability is what the customer experiences over time and hence considered a better metric in the longer run.
In conclusion, by comparing the four capability indexes you can quickly get some idea about how a process is being operated. Here are three typical questions a manager may ask that capability can help answer about a process:
- How close is it to being operated to its full potential?
- Is it being operated on-target?
- Can it meet the process requirements without the trouble and expense of improvements or reengineering?
Now let’s consider a less common scenario where capability can be used.
What if your Target is not-centered between the Spec Limits?
Example 1: Imagine a customer service manager who wants to improve the response time to customer complaints. Historical performance shows that it can be anywhere from 2 hours to 24 hours. The manager decides to establish a USL=12 hours and LSL=0 hours, but with a target=4 hours.
Example 2: Consider a printed circuit board manufacturer who will be depositing a precious metal (e.g., gold, silver, etc.) on the board. In order to minimize costs the manufacturer would want to operate close to the lower specification limit rather than at the midpoint between the USL and LSL.
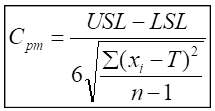
If you face this kind of situation – when the preferred target is closer to the one of the spec limits – you should use a different process capability index, called Cpm.
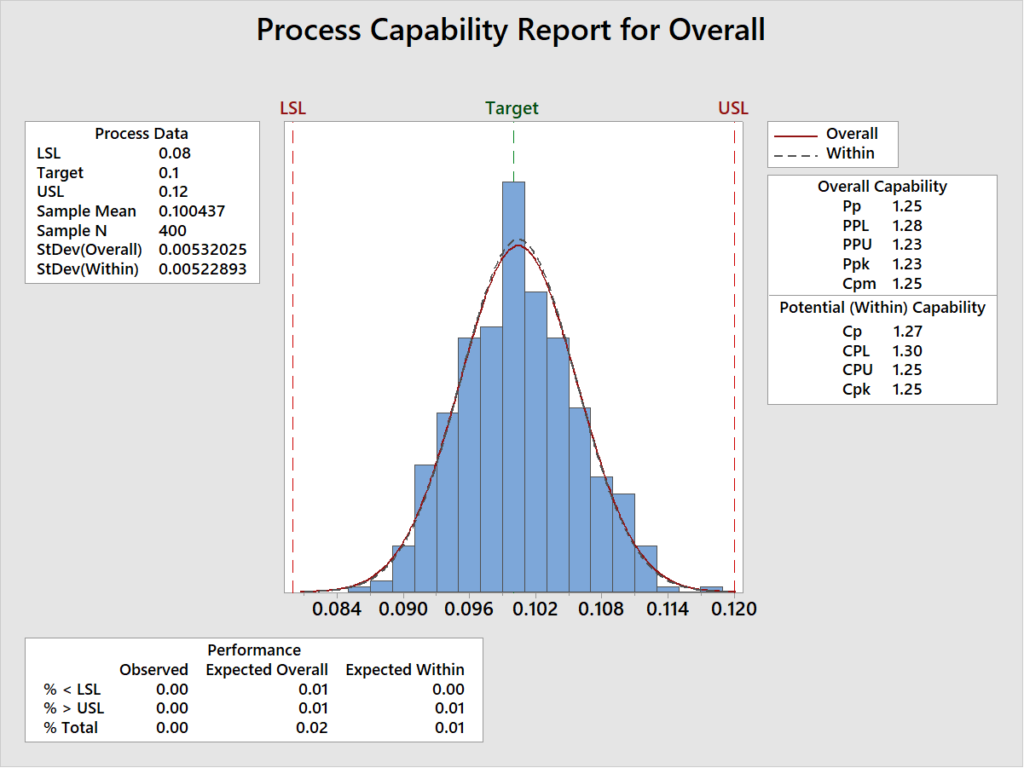
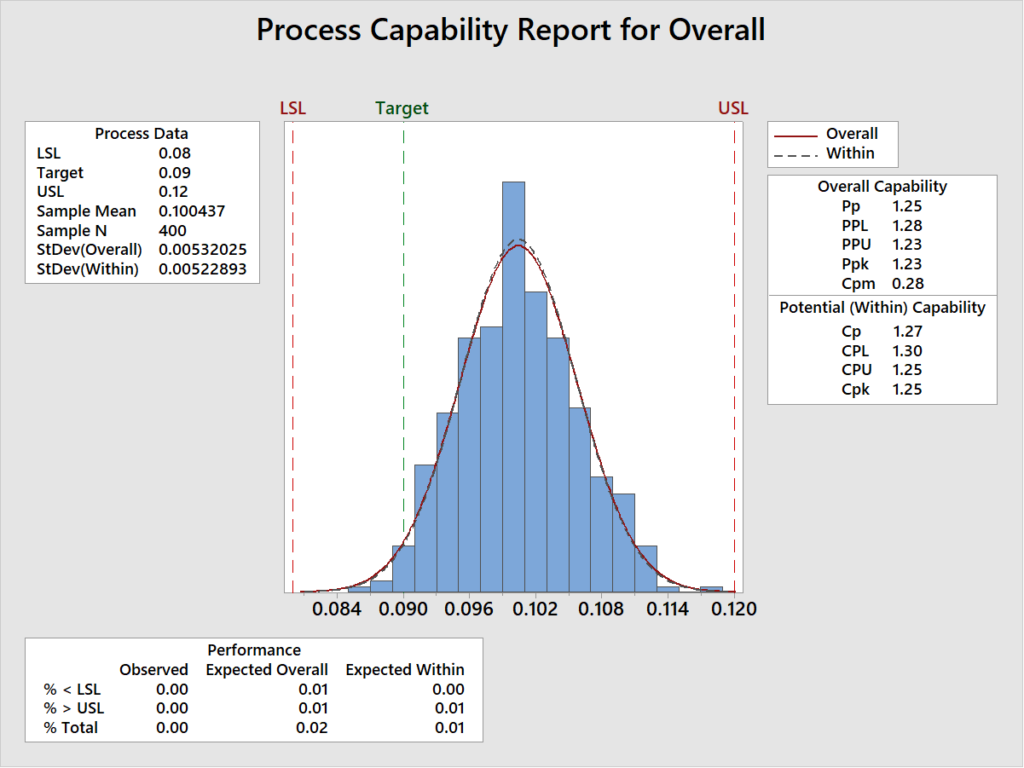
Illustration of Process Target Centered vs Process Target not Centered
As you can see in the illustration above, when the process Target is centered between the spec limits, the Cpk and Cpm have the same value of 1.25. However, when the process target is not centered, the Cpm value is different than the Cpk value. This due to the fact that the Cpm capability index takes into account the bias (i.e., difference) from the Target. This bias is the average between Process center and the Target. Cpm is calculated using the following formula:
This Cpm capability index is based on the Taguchi loss curve concept. According to statistician Dr. Genichi Taguchi (1924-2012), as the process mean deviates from the target, a loss is generated and quality becomes progressively worse. Therefore, just staying within specifications is not enough. A good process not only performs with the allowed width, but also centers around the target.

Illustration source: https://blog.minitab.com/blog/applying-statistics-in-quality-projects/how-could-you-benefit-from-the-cpm-capability-index
In conclusion, Part-two of this series covers the following nuances within capability studies:
- Differentiating and Interpreting “Short-term” vs “Long-term” Process capability indices
- Use of Cpm Capability index, when you Target is not centered
In the next part of this series, we will further discuss process capability studies when working with Continuous, Non-Normal Data.
