LSS Lessons from Vaccine Research
As we start the new year the global pandemic continues to claim lives at a terrible pace, with over 400,000 lost to COVID-19 in the US alone as of this writing. The good news: Multiple vaccines have been approved for use, and vaccinations began starting in December. One of those vaccines was jointly developed by Pfizer and BioNtech. Known as BNT162b2, this vaccine was used in a Phase 3 study with a reported efficacy of 95% against COVID-19.
What can Lean Six Sigma practitioners learn from the methods used by epidemiologists, physicians, and others who performed this research? And how can these methods be adapted to a LSS project?
In this blog I will provide an overview of how the Pfizer study was conducted. In doing so I’d like to make it clear this research was performed in a planned, rigorous manner based on sound, scientific principles. Also, I will show how Pfizer’s methods relate to those used in Lean Six Sigma. They include:
- Operational Definitions
- Representative Samples and Data Collection
- Blind, Random Studies
- Hypothesis Testing and Confidence Intervals
- Power and Sample Size
Before discussing any of the research I want to be clear on some things I will not discuss:
- Past research on vaccines for other viruses. It is my understanding that lessons learned in research conducted on many other viruses over the past 30+ years was critical to the development of this vaccine.
- How the vaccine works, or a discussion of viruses in general. There are plenty of online articles on these topics.
All belts understand the key concept of Operational Definitions. In reviewing vaccine research, the term efficacy is frequently used. You will also sometimes see effectiveness. These terms have different meanings as shown below:
| Measure | Study Type | Random? | Controlled? | Participants |
| Efficacy | Planned | Yes | Yes | Sample |
| Effectiveness | Observational | No | No | Population |
On a more basic level, efficacy is a measure used for formal studies whereas effectiveness is a ‘real world’ measure. Both are used to show the impact of a treatment (the Pfizer vaccine), on a medical condition (infection from the COVID-19 virus).
Here is a summary of the study results with efficacy as the key measure:
“Data from 43,448 participants … showed that the vaccine candidate was well tolerated and demonstrated 95% efficacy in preventing COVID-19…”
Now, for an overview of the study. The study began in July 2020 and continues to be open. Preliminary results were shared in November, once specific study goals were achieved. In December updated results were reported, and the vaccine was approved on an emergency basis in the US by the Food and Drug Administration.
The study involved 150 clinical trial sites, with participants from six countries: United States, Germany, Turkey, South Africa, Brazil, and Argentina. Also, a variety of ethnicities, genders, and age groups were recruited for the study with the goal to ensure the vaccine worked for as wide a range of people as possible.
Here is a summary of the participants in terms of age and ethnicity:
| Race/Ethnicity | Overall | U.S. Only |
| Asian | 5% | 6% |
| Black | 10% | 10% |
| Hispanic/Lantinx | 26% | 13% |
| Native American | 1.1% | 1.3% |
| Age Group | Number | Percent |
| 12-15 | 1,090 | 2.4% |
| 16-17 | 738 | 1.6% |
| 18-55 | 25,527 | 56.4% |
| 56+ | 17,893 | 39.5% |
| Total | 45,248 | 100% |
This information shows how researchers used the concept of representative sample data. In addition, it includes the sampling concept of a stratified random sample. Here the strata (groups) are based on age and ethnicity. Note that some demographic groups were not included in the study, such as young children and pregnant women.
Collecting data representative of a process is a critical goal in Lean Six Sigma. Consider a Black Belt working in a factory to improve quality. As part of the Measure Phase she would devise a data collection plan to gather sample data from all three shifts in the factory to ensure it was representative of the overall process.
Next, the basics of how the study was performed. Here is another excerpt from the press release about this research:
“The ongoing Phase 3 clinical trial of BNT162b2 … has enrolled more than 44,000 participants, the vast majority of whom have received their second dose…The Phase 3 trial is designed as a 1:1 vaccine candidate to placebo, randomized, observer-blinded study to obtain safety, immune response, and efficacy data needed for regulatory review.”
There is a lot to unpack in these statements! Let’s take them one by one.
First, note the statement about enrolling participants. Just because someone enrolls in a study doesn’t mean the person completed it. Keep in mind the Pfizer vaccine required two shots to be administered, with 21 days between shots. If a participant received the first shot but did not come back for the second shot, then that person was excluded from the study results.
Second, this is a 1:1 vaccine candidate to placebo study. In other words, half the participants were given the vaccine and the other half a placebo (i.e., an inert substance meant to have no effect on patient health). Third, this is a randomized trial. This means participants were randomly assigned to either the vaccine group or the placebo group.
And importantly, this is also a blind study. This means the person receiving the shot does not know if they are receiving the vaccine or the placebo. Actually, this is a ‘double blind’ study, which means the nurse or physician administering the shot also does not know if it contains the vaccine or placebo.
All belts will recall these exact methods are used in Measurement System Analysis. Samples are chosen which are representative of the process. The samples are then randomly given to the person measuring them. And the samples are blind to study participants. The goal of making the samples ‘blind’ to the participants is to minimize risk of bias in how results are reported.
These same concepts are also used in Design of Experiments where randomization is performed to minimize the risk of confounding with environmental factors. It turns out this same approach – a randomized, controlled trial (RCT) – is considered the ‘Gold Standard’ in medical research.
Now, let’s look at the results from the study:
| Positive Test for COVID | Positive Test for COVID | ||
| Participants | Number | Percent | |
| Placebo | 21,728 | 162 | 0.746% |
| Vaccine | 21,720 | 8 | 0.037% |
| Total | 43,448 | 170 |
The efficacy is measured as the improvement in the infection proportion from one group (placebo) to the other (vaccine). This can be calculated as:
Efficacy = 1 – (0.037/0.746) = 95%
The efficacy measure indicates the infection proportion was 95% lower in the study participants who received the vaccine as compared to the participants who received the placebo.
Now, some points to keep in mind. As noted above, study participants were put randomly into each group. At the same time, researchers had to be sure to incorporate the different age groups and ethnicities (i.e., the population strata).
A question sometimes asked about such studies is whether participants are purposefully infected with the COVID-19 virus. The answer is ‘No’ because that would violate medical research ethics guidelines. Instead, once each participant received their two shots they were told to go about their lives in a normal manner. And researchers waited to see how many would be infected.
Next, let’s use a hypothesis test to confirm if there was a statistically significant difference between the vaccine group and the placebo group. What test is appropriate for this situation? We have attribute data which is binary. Participants either tested positive during the study or did not. And we have two sets of sample data. Hence, a 2-proportion hypothesis test should be used.
The exact same hypothesis test would be appropriate for many different Lean Six Sigma projects to compare Before-After sample data. Examples include projects such as improving on-time delivery, reducing scrap levels, and increasing sales quote success.
For the Pfizer study the null hypothesis is that the proportion infected in each group was the same. And the alternative is the proportions were different. Researchers believed the participants administered the vaccine would have a lower proportion that were infected. This means the alternative hypothesis should be that p1 (placebo group) was higher than p2 (vaccine group). Here is how it would be shown:
Null Hypothesis: H0 : p1 = p2
Alternative Hypothesis: Ha : p1 > p2
A 2-proportion test for the study data was run in Minitab with the following output:
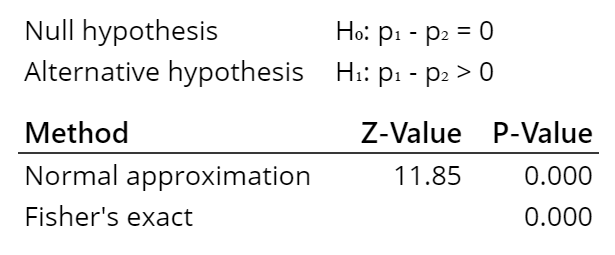
For this test there are two different methods used to calculate the p-value. Both give the same results, a low p-value (below alpha of 5%). Which means we can reject the null hypothesis (that the two groups have the same proportion or percentage of infection) and instead conclude the alternative hypothesis is correct (the group receiving the vaccine had a lower proportion of infections).
The final statistical tool familiar to LSS practitioners which was used by Pfizer researchers is that of power and sample size. As you will recall, power is a measure related to the risk of a Type 2 error – a false negative. It is also associated with the ability to detect a change of a given size (i.e., the effect). And confidence level is a measure of risk of a Type 1 error – a false positive. For the Pfizer researchers a Type 1 error would be to conclude the vaccine prevented the virus when it did not. And a Type 2 error would be the opposite, concluding the vaccine had no effect when it did prevent the virus.
To do this calculation an estimate of the efficacy level due to the vaccine is required. Of course, researchers at Pfizer did not know this value before the study began. The FDA provides guidance on the recommended efficacy level to use for such calculations, with a minimum of 50% efficacy, and a lower bound of 30% for the confidence interval. These planning values can be used to determine the sample size.
That is how Pfizer developed a plan for a total of 44,000 participants, with half in each group. And a goal was also determined for the minimum number of individuals who needed a positive test for the virus for analysis of the outcomes to be statistically valid.
In summary, from the study data we can conclude that individuals who receive the Pfizer vaccine have a statistically significant effect of not contracting the coronavirus versus those individuals not getting vaccinated. More importantly, the size of the effect is practically significant (95% lower risk of infection as compared to the unvaccinated group). However, reaching the goal of vaccinating 75% of the population to achieve ‘herd immunity’ is a different story. We have a long way to go to achieve this goal, with many challenges to overcome. Sounds like another opportunity to apply LSS!
For information on the Pfizer website about this specific study:
For a discussion of the difference between efficacy and effectiveness:
https://www.gavi.org/vaccineswork/what-difference-between-efficacy-and-effectiveness
