
Case Studies in Utilizing Industry 4.0
Over the past two decades TMAC has seen excellent results by our customers as they applied Lean Six Sigma to improve their business processes. Despite their success, it is increasingly apparent they are missing out on an opportunity to get even better results. How, you ask? Through the application of Industry 4.0.
Not familiar with Industry 4.0? You can learn the basics in my blog Smart Manufacturing and Lean Six Sigma. Perhaps you know a little about Industry 4.0 but aren’t sure how to get started. Check out my blog from last fall on this question: Are You Leveraging Industry 4.0 Technologies for Your CI Efforts?
As we get further into the 21st century TMAC is seeing more and more customers take advantage of these evolving technologies to not only complement but accelerate their continuous improvement efforts. To illustrate, I’d like to share a couple of projects where TMAC partnered with customers using this approach.
I want to be clear on a few important points. First, these projects were not initiated as “technology projects”. Rather, each project started as a specific business problem. As TMAC worked with each company the opportunity to utilize technology-based solutions was identified. We discussed these ideas with the management team and made sure they were comfortable with how the technology complemented the more traditional CI methods. Second, in each case study the technology used was relatively simple, but effective. The lesson learned: You don’t have to use overly complex technology to get started on your Industry 4.0 journey. Start small, then build from there.
Case Study 1: Is the investment in a process change worth the effort?
Recently TMAC conducted an E3 Assessment (E3: Economy, Energy, and Environment) at a local metal finishing company. The project team began by mapping their electroplating process. Through value stream mapping the team determined the constraint was the etching operation. Every morning, etch tanks require a warm-up period to get to the required temperature for production to begin. The team categorized this as a non-value add activity (i.e., Setup Time).
While there was anecdotal evidence of how long this process took each day, the team realized there were no established metrics in place for the tank temperatures or the time needed to reach the required temperatures. The TMAC technology team was consulted to help address this issue.
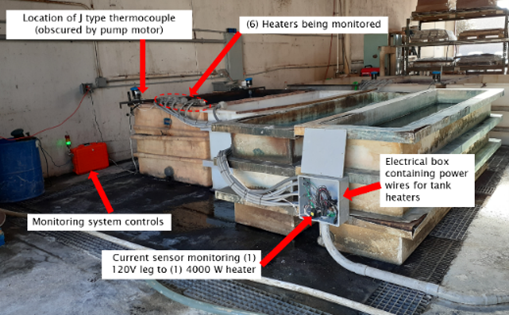
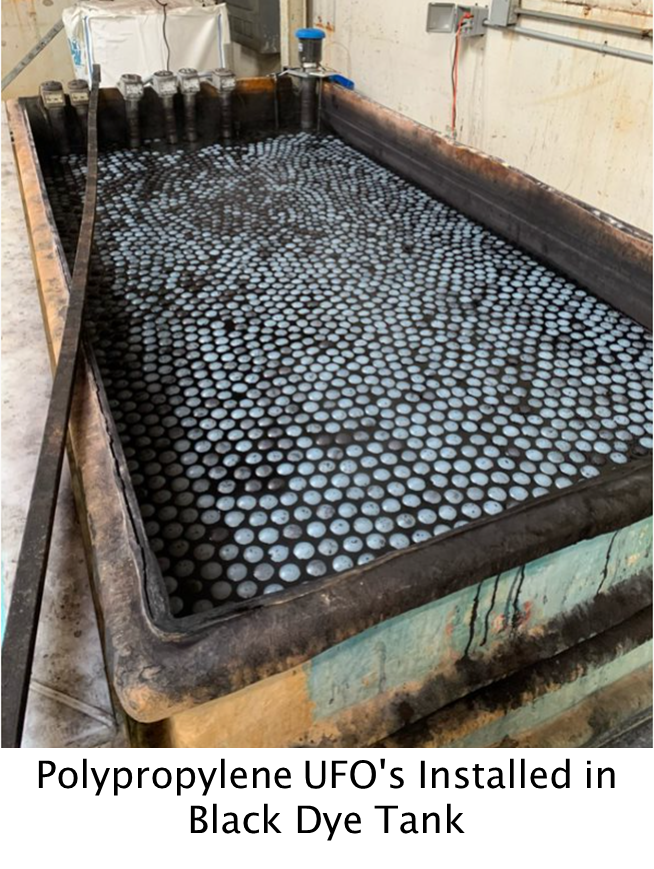
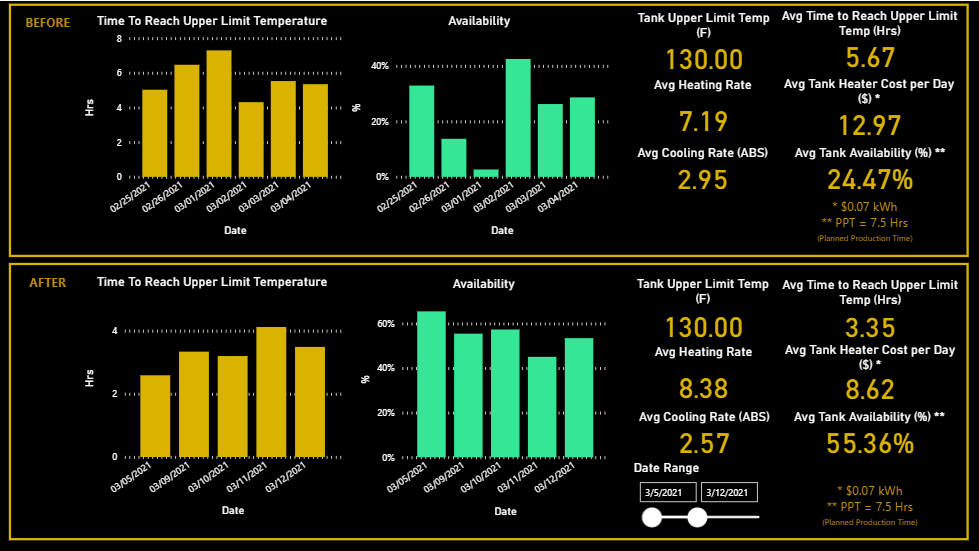
After consulting management, the project team decided to conduct a pilot project on a single etch tank. A machine monitoring system was deployed which included a few thermocouples to monitor the tank temperature and actual machine performance. Data was collected in real-time over a period of 4 weeks. Using this data, the team identified significant heat loss from the uninsulated etch tanks. The team decided to address this problem by insulating the etch tank with “UFO style” floats (see below) to cover the surface of the etching solution. Data was then continuously captured using the thermocouple monitoring system to measure the actual energy consumption before and after the insulating spheres were installed. TMAC developed Power BI dashboards (available in real-time and remotely to company management) to allow easy monitoring of the new system. The dashboards confirmed the benefits of insulating the etch tanks. While the energy savings were impressive (a reduction of 85,000 kWh) the real win for the company was the 31% increase in available etch tank capacity. The organization also benefited from a $3,500 sales tax refund from their manufacturing electricity usage.
This project is an example where Machine Monitoring technology was deployed to continuously monitor the constraint. The monitoring technology enabled effective decision making by the management team.
Case Study 2: Where is waste generated in my existing process?
In any kaizen event, identification of the 8 wastes of lean is a fundamental first step in addressing improvement opportunities. Traditionally, this is done through process mapping, observation, manual/automated data capture and anecdotal knowledge of the process. In addition, time studies – which are very human intensive – are also performed.
I distinctly remember doing this for a project many years ago (2003 to be exact) where we did the following:
- Create the current state value stream map of the process
- Perform time studies on all process steps
- Break down each process step to its fundamental elements and capture both value-add and non-value add times
- Analyze the results and identify improvement opportunities (Analyze and Improve Phases)
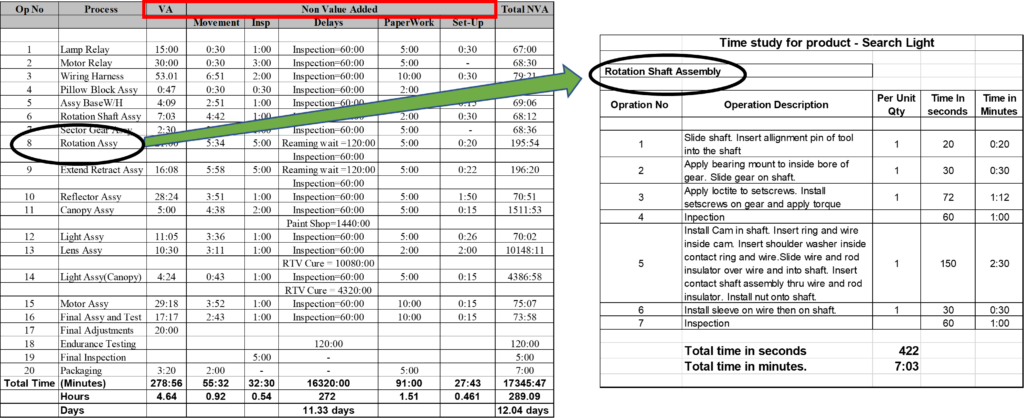
Fast forward to a project in 2022. This time, instead of doing traditional time studies requiring lots of time and tediously documenting each step we instead used a remote Camera Monitoring system to develop heat maps tracking human movement. We used this system to collect data on 3 different operations over a month. That data was captured, uploaded to a cloud server, and then analyzed. Activities were separated into distinct categories (e.g., on-machine time, walking, cleaning, searching, handling, etc.). Video analysis was performed to categorize operations as customer value-add or non-value add.
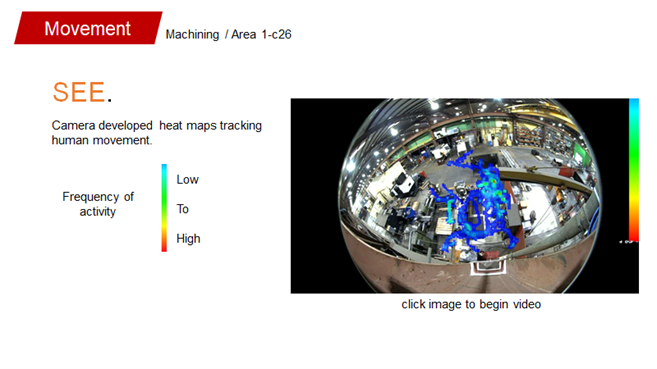
Basically, we performed the same task of identifying CVA and NVA as my project in 2003. The key difference: Technology did the work in 2022. Benefits include:
- Eliminated observer influence: It is human nature to be nervous when someone is watching over your shoulder. By deploying the camera system there are no observers to influence operators. After a day or two, they even forget they are being recorded and do their jobs without outside influence
- Increased data sample: In a traditional time-study, each operation is observed 3 to 5 times and an average task time is determined. Using the camera system, each activity can be observed dozens of times, or more. This gives the opportunity to not only include short term variation, but also any long-term variation.
- Removed human error and bias of observers: Even well qualified and experienced engineers can make mistakes. By removing human involvement from data collection any possible bias is removed from the observation process.
- Simplified Analysis: The camera systems are designed to categorize the task into distinct categories, which sped the analysis of the study. No more Excel templates and complicated calculations.
- Ability to rewind and re-learn: Since the data is remotely captured and recorded, you can re-watch the process as many times as you need.
Conclusion:
While technology adoption may not be feasible in all projects, the cost of its adoption is rapidly declining. Increasingly TMAC customers are finding it is worth the investment. We are actively seeking opportunities to partner with customers to integrate technology solutions as part of their CI efforts whether implementing Lean, Quality or Strategy Deployment. Some additional examples of how technology can be integrated into a CI Program:
- Real-time Data Capture & Reporting of process performance through (cloud-based) dashboards
- Improving Quality Control (through sensor or camera-based vision systems)
- Addressing Non-Value Add Activities (If elimination is not possible, automate dull & dangerous tasks)
- Improving Safety (Ergonomic assessments using wearable devices, audio-visual alerts, visual management)
- Workforce Skills Development (Augmented Reality/Virtual Reality technologies)
What I4.0 Technologies have you employed in your CI Efforts? Please share your experiences as we all are in this collective journey in pursuit of perfection.
