
Process Capability: A Critical Management Tool (Part 1)
A design engineer wants to know if a manufacturing process can meet design tolerances. A quality engineer wants to determine the rate of poor quality. A purchasing agent wants to assess if a supplier can provide parts that will work properly in a subassembly. A sales manager wants to know if his team can meet their business goals. A LSS Black Belt wants to establish the baseline for her project.
Are you one of those individuals tasked with answering these kind of business questions? While there are many approaches to answer these questions, Process Capability is a perfect tool because it not only provides a simple, visual method to understand process performance that makes sense to non-practitioners, it also offers a way to quantify level of performance that is meaningful to those trained in statistics.
So what is process capability?
In its most basic form, process capability can be described as a quantifiable comparison of “Voice of the Customer” to “Voice of the Process”. It is the ability of a process (based on historical performance) to meet its customer/business requirements. The requirements are in the form of process/product specifications, sometimes called tolerances.
Conceptually, this comparison can be shown as a simple ratio of allowed variation (VOC) to expected variation (VOP):
Process Capability = Voice of the Customer (VOC) / Voice of the Process (VOC)
Once the capability of a process is determined, the manager of the process can use that information to decide what actions – if any – should be taken. Typical questions a manager may have that can be answered include:
- Is a process capable of meeting customer requirements?
- Did recent changes to a process (e.g., new staff, raw materials, equipment, or procedures) make a positive change in the ability of the process to satisfy customers?
- What was the impact of improvement activities – such as lean or six sigma methods – on process performance?
But before you can go off and perform a capability analysis, there are some prerequisites that must be verified.
- What is the business question? [How does process performance impact business goals?]
- What are the process requirements/goals (VOC)? [What are the process specifications or tolerances?]
- Is process data available (VOP)? If so, how was it collected? [Is there enough data, in the proper format, to characterize the process? It the data representative of the process?]
- Can you trust the data? [Is the measurement system used to collect the data adequate?]
- Is the underlying process under control? [Is the process consistent and stable enough to trust the capability results?]
- Finally, is the data normally distributed? Or some other distribution? [While data distribution is not a limitation to performing capability analysis, knowing this is critical to ensure the right statistical analysis is performed]
Note: One word of caution when using process capability analysis. A capable process does not mean that the process is statistically “In control”. These are two separate questions. Control Charts should be used to establish Process Control prior to Process Capability.
Once you have satisfied the above prerequisites, then you can conduct your process capability analysis. As noted above, process capability is measured using two different unit-less indices: Cp and Cpk. While Cp describes the process potential, Cpk describes the process performance. In simple terms, Cp is a measure of process width relative to allowed width and Cpk is a measure of process variation plus how well it is operating on Target. However, both these indices use the same basic principle of comparison of the VOC to VOP. Finally – a higher value is better for each of these indices.
Cp and Cpk are calculated as shown below, where USL represents the Upper Specification Limit, LSL represents the Lower Specification, represents the process mean and represents process variation (standard deviation). The ‘k’ in Cpk is for the Japanese word katayori which means ‘offset or deviation’. In other words, Cpk accounts for the offset of the process mean whereas Cp does not. Note: The Cpk calculation assumes a process target that is midway between the USL and LSL.

Graphically, an example of Cp is shown in Figure 1, while Cpk is shown in Figure 2:
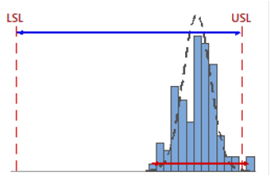
Figure 1
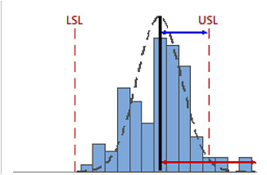
Figure 2
Both Cp and Cpk are comparing the VOC (Horizontal Blue Line) to the VOP (Horizontal Red Line). However, Cp does not take into account the Process Target (Black Line in Figure 2). But Cpk does incorporate the location of process target in comparison to the spec limits. Hence it is essential to consider both these indices to establish process performance.
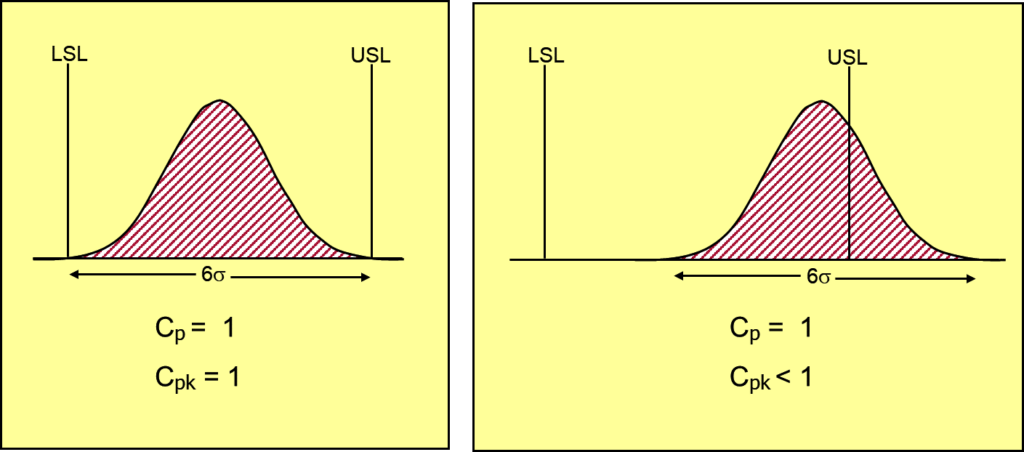
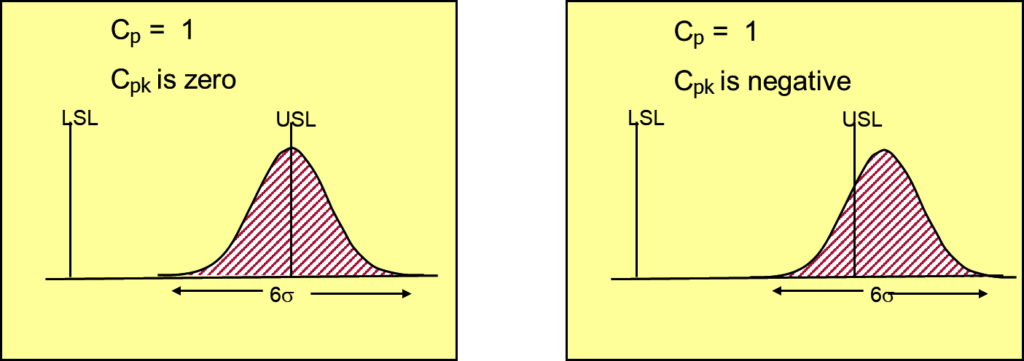
While Cp cannot have negative values, Cpk can have negative values. This occurs when the process mean is outside the specification limits. As stated above, the larger the Cp and Cpk values, the better the process performance. In general, a common goal for Cp and Cpk values is 1.33 or higher. For critical processes (e.g., in the food and drug industry) this goal may be increased to 1.67.
See below for an example of a process having a Cp which is the same for all four scenarios but with differing Cpk values depending on where the process mean is in comparison to specification limits. Note that if the process is centered on the spec limits that Cp = Cpk.
This blog is meant as a basic introduction to capability concepts. There are many additional nuances and considerations in performing Process Capability studies including:
- How to differentiate between Short term vs. Long term capability?
- What if the process target is not centered between the specification limits?
- What if the data does not follow Normal Distribution?
- What kind of impact does process variation have on capability indices?
- How to assess capability for attribute data?
These topics will be covered in a future blog.
